Electrify Chicago
An independent tool for viewing City of Chicago building data
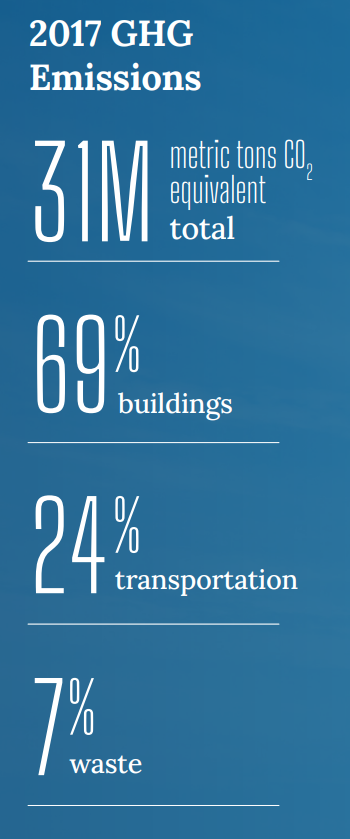
According to the
2022 Chicago Climate Action Plan ,
69% of Chicago's emissions come from buildings, making
building emissions our biggest challenge and our biggest opportunity as a city
to tackle climate change. At Electrify Chicago, we showcase building performance using
publicly available data supplemented by community-submitted photographs and building
owners.
,
69% of Chicago's emissions come from buildings, making
building emissions our biggest challenge and our biggest opportunity as a city
to tackle climate change. At Electrify Chicago, we showcase building performance using
publicly available data supplemented by community-submitted photographs and building
owners.
Start by looking at Chicago's buildings with the highest greenhouse gas intensity i.e. emissions per square foot. Large, efficient, buildings can perform much better than very inefficient small buildings on this metric.
New Article
📰 $30 Million In Missed Fines
The City Of Chicago failed to collect $30 million in potential fines from the building benchmarking ordinance, reducing transparency and accountability.
Legislative update! 🎉
As of late January 2024, legislation is being introduced to require new use more efficient forms of water and space heating, via the Clean And Affordable Buildings Ordinance (CABO), which will reduce the number of highly polluting and inefficient buildings that end up on this site.
If you're in Chicago,
write to your alderman to support the CABO!
Chicago Buildings by Greenhouse Gas Intensity
Note: Data includes large Chicago buildings with data from 2022, unless explicitly stated otherwise.
Note: This data only includes buildings whose emissions are reported
under the
Chicago Energy Benchmarking Ordinance. According to the City “As of 2016,
this list includes all commercial, institutional, and residential buildings larger than
50,000 square feet.” This dataset is also then filtered to only buildings with
reported emissions > 1,000 metric tons CO2 equivalent.
The latest year of data is from 2022, but we update the site regularly when new data is available, and some buildings may have failed to report that year, and only have older data available.
| Property Name / address | Primary Property Type |
Greenhouse Gas Intensity (kg CO2 eq./sqft) |
Total Greenhouse Emissions (metric tons CO2 eq.) |
|---|---|---|---|
|
ACE Technical Charter High School
🕰️
(CPS)
5400 S State St
| K-12 School | 0.9 kg/sqft | 59 tons |
|
PowellStBrdg-CPS
🕰️
(CPS)
7765 S COLES AVE
| K-12 School | 0.8 kg/sqft | 80 tons |
|
318 West Adams Commercial Condo Assoc.
🏆
318 W Adams St
| Office | 0.8 kg/sqft
#5 Lowest in Chicago*
| 133 tons
#16 Lowest in Chicago*
|
|
The Chicago Theatre
🏆
175 N State St
| Performing Arts | 0.8 kg/sqft
#5 Lowest in Chicago*
| 538 tons
Lowest 29%
|
|
6160 N Cicero
🕰️
6160 N CICERO AVE
| Office | 0.8 kg/sqft | 51 tons |
|
Market Place at Six Corners 10361
🏆
4612 - 4730 W Irving Park Rd
| Other - Mall | 0.8 kg/sqft
#5 Lowest in Chicago*
| 91 tons
#7 Lowest in Chicago*
|
|
Headquarters Q12380
🕰️
225 W Randolph
| Office | 0.8 kg/sqft | 761 tons |
|
Dugan-CPS
🕰️
(CPS)
4541 S Wood St
| K-12 School | 0.7 kg/sqft | 62 tons |
|
SouthLoopBrn-CPS
🕰️
(CPS)
1915 S FEDERAL ST
| K-12 School | 0.7 kg/sqft | 148 tons |
|
Cambria Hotel
🕰️
32 W RANDOLPH ST
| Hotel | 0.7 kg/sqft | 166 tons |
|
1830 N WINCHESTER AVE
🏆
1830 N WINCHESTER AVE
| Multifamily Housing | 0.7 kg/sqft
#3 Lowest in Chicago*
| 47 tons
#2 Lowest in Chicago*
|
|
811 E. 46th
🕰️
811 E. 46th St
| Multifamily Housing | 0.6 kg/sqft | 44 tons |
|
Belding Earl-CPS
🕰️
(CPS)
4209 W Irving Park Rd
| K-12 School | 0.5 kg/sqft | 37 tons |
|
U.S. Cellular Plaza - 8420 _ Goby LLC
🏆
8420 W Bryn Mawr Ave
| Office | 0.5 kg/sqft
#2 Lowest in Chicago*
| 103 tons
#10 Lowest in Chicago*
|
|
2255 S MICHIGAN AVE
🕰️
2255 S MICHIGAN AVE
| Office | 0.5 kg/sqft | 22 tons |
Data Source:
Chicago Energy Benchmarking Data